


10 Charts Mapping February’s Deep Tech Capital Movement
Which startups are securing the biggest checks? What sectors are growing fastest? The data tells the story.

✨ Hi there! This is the Premium Edition of The Scenarionist. Unlock the full experience by becoming a Premium Member!
Every week, we track deals, map capital flows, and analyze the trends shaping the deep tech landscape. We collect data, clean it, scrutinize it, and extract meaningful insights—so you don’t have to.
This time, we decided to do something different. What if we visualized this data to make it even clearer and more actionable?
So, we ran an experiment. For our premium members, we’ve transformed our research into 10 visual charts, offering a curated, independent, and visually compelling view of how capital moved last month.
Some of the key questions we’ve answered—at a glance:
Which sectors are attracting the most capital?
Where is deep tech funding accelerating?
How are venture capital investments evolving globally?
The result? A big-picture view of an industry that’s complex, dynamic, and constantly evolving.
Get full access—join The Scenarionist Premium today.
Chart 1: A Dynamic Shift in Monthly Deal Flow
Monthly Deal Distribution by Funding Stage

The graph illustrates the distribution of deals across different funding stages throughout the month.
This pattern suggests that early-stage investments remain dominant, while later-stage deals gain traction in the latter part of the month.
Chart 2: Mapping Deep Tech Capital Across Stages and Regions
Investment Flow by Funding Stage and Region
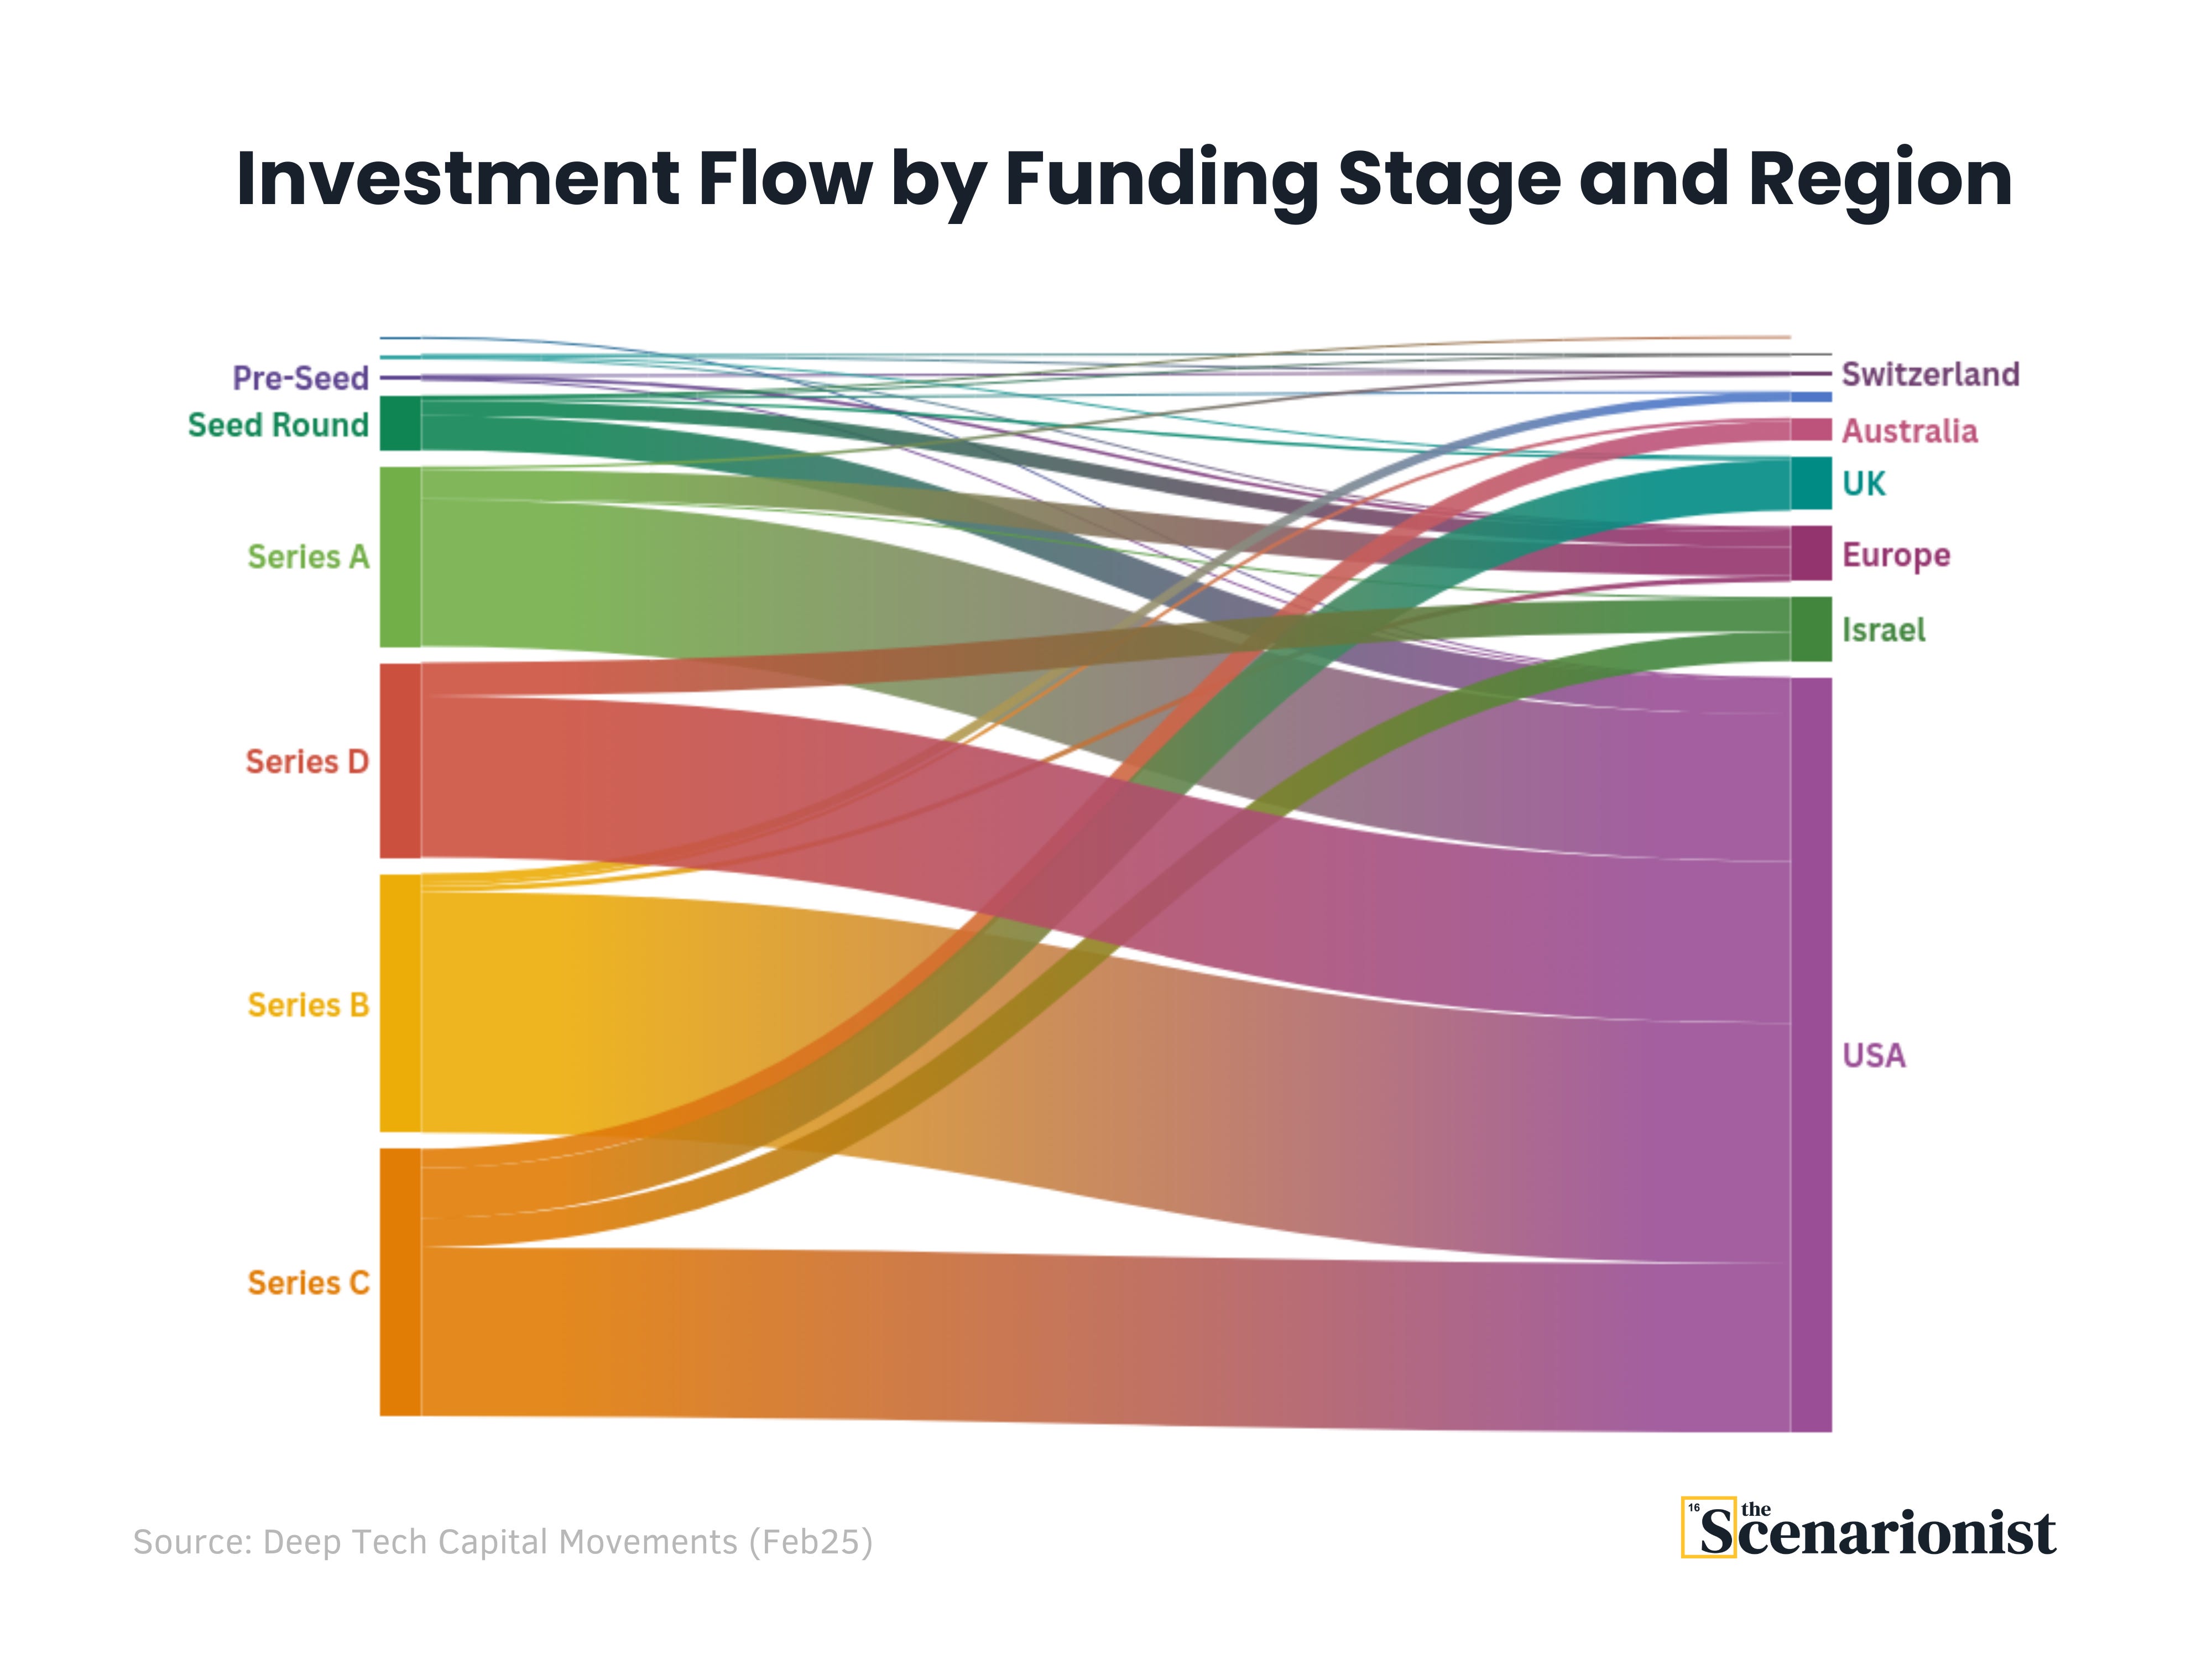
The chart illustrates the distribution of investment capital from early-stage funding rounds to later-stage growth across different regions.
Notably, Series A and Seed investments display a more diverse regional spread, while later-stage rounds (Series C and beyond) are increasingly concentrated in the USA. This trend underscores the challenges of scaling deep tech startups outside the most mature venture ecosystems.
Chart 3: Early-Stage Dominance in Deep Tech Deals
Number of Deals by Funding Stage

This radar chart visualizes the distribution of deals across different funding stages
Seed-stage investments account for the largest share, highlighting investor confidence in early-stage deep tech ventures. Meanwhile, later-stage funding (Series B and beyond) is significantly less frequent, reflecting the higher barriers to scaling in this sector.
Chart 4: The Inverse Relationship Between Deal Volume and Capital Raised
Number of Deals vs. Total Capital Raised Across Funding Stages

The sharp decline in deal count from Seed to later stages contrasts with the exponential growth in capital raised.
This signals that deep tech investors prefer to spread risk at early stages but concentrate capital in a smaller number of high-performing startups as they scale.
Chart 5: February's Largest Deep Tech Funding Rounds
February's Largest Deep Tech Funding Rounds
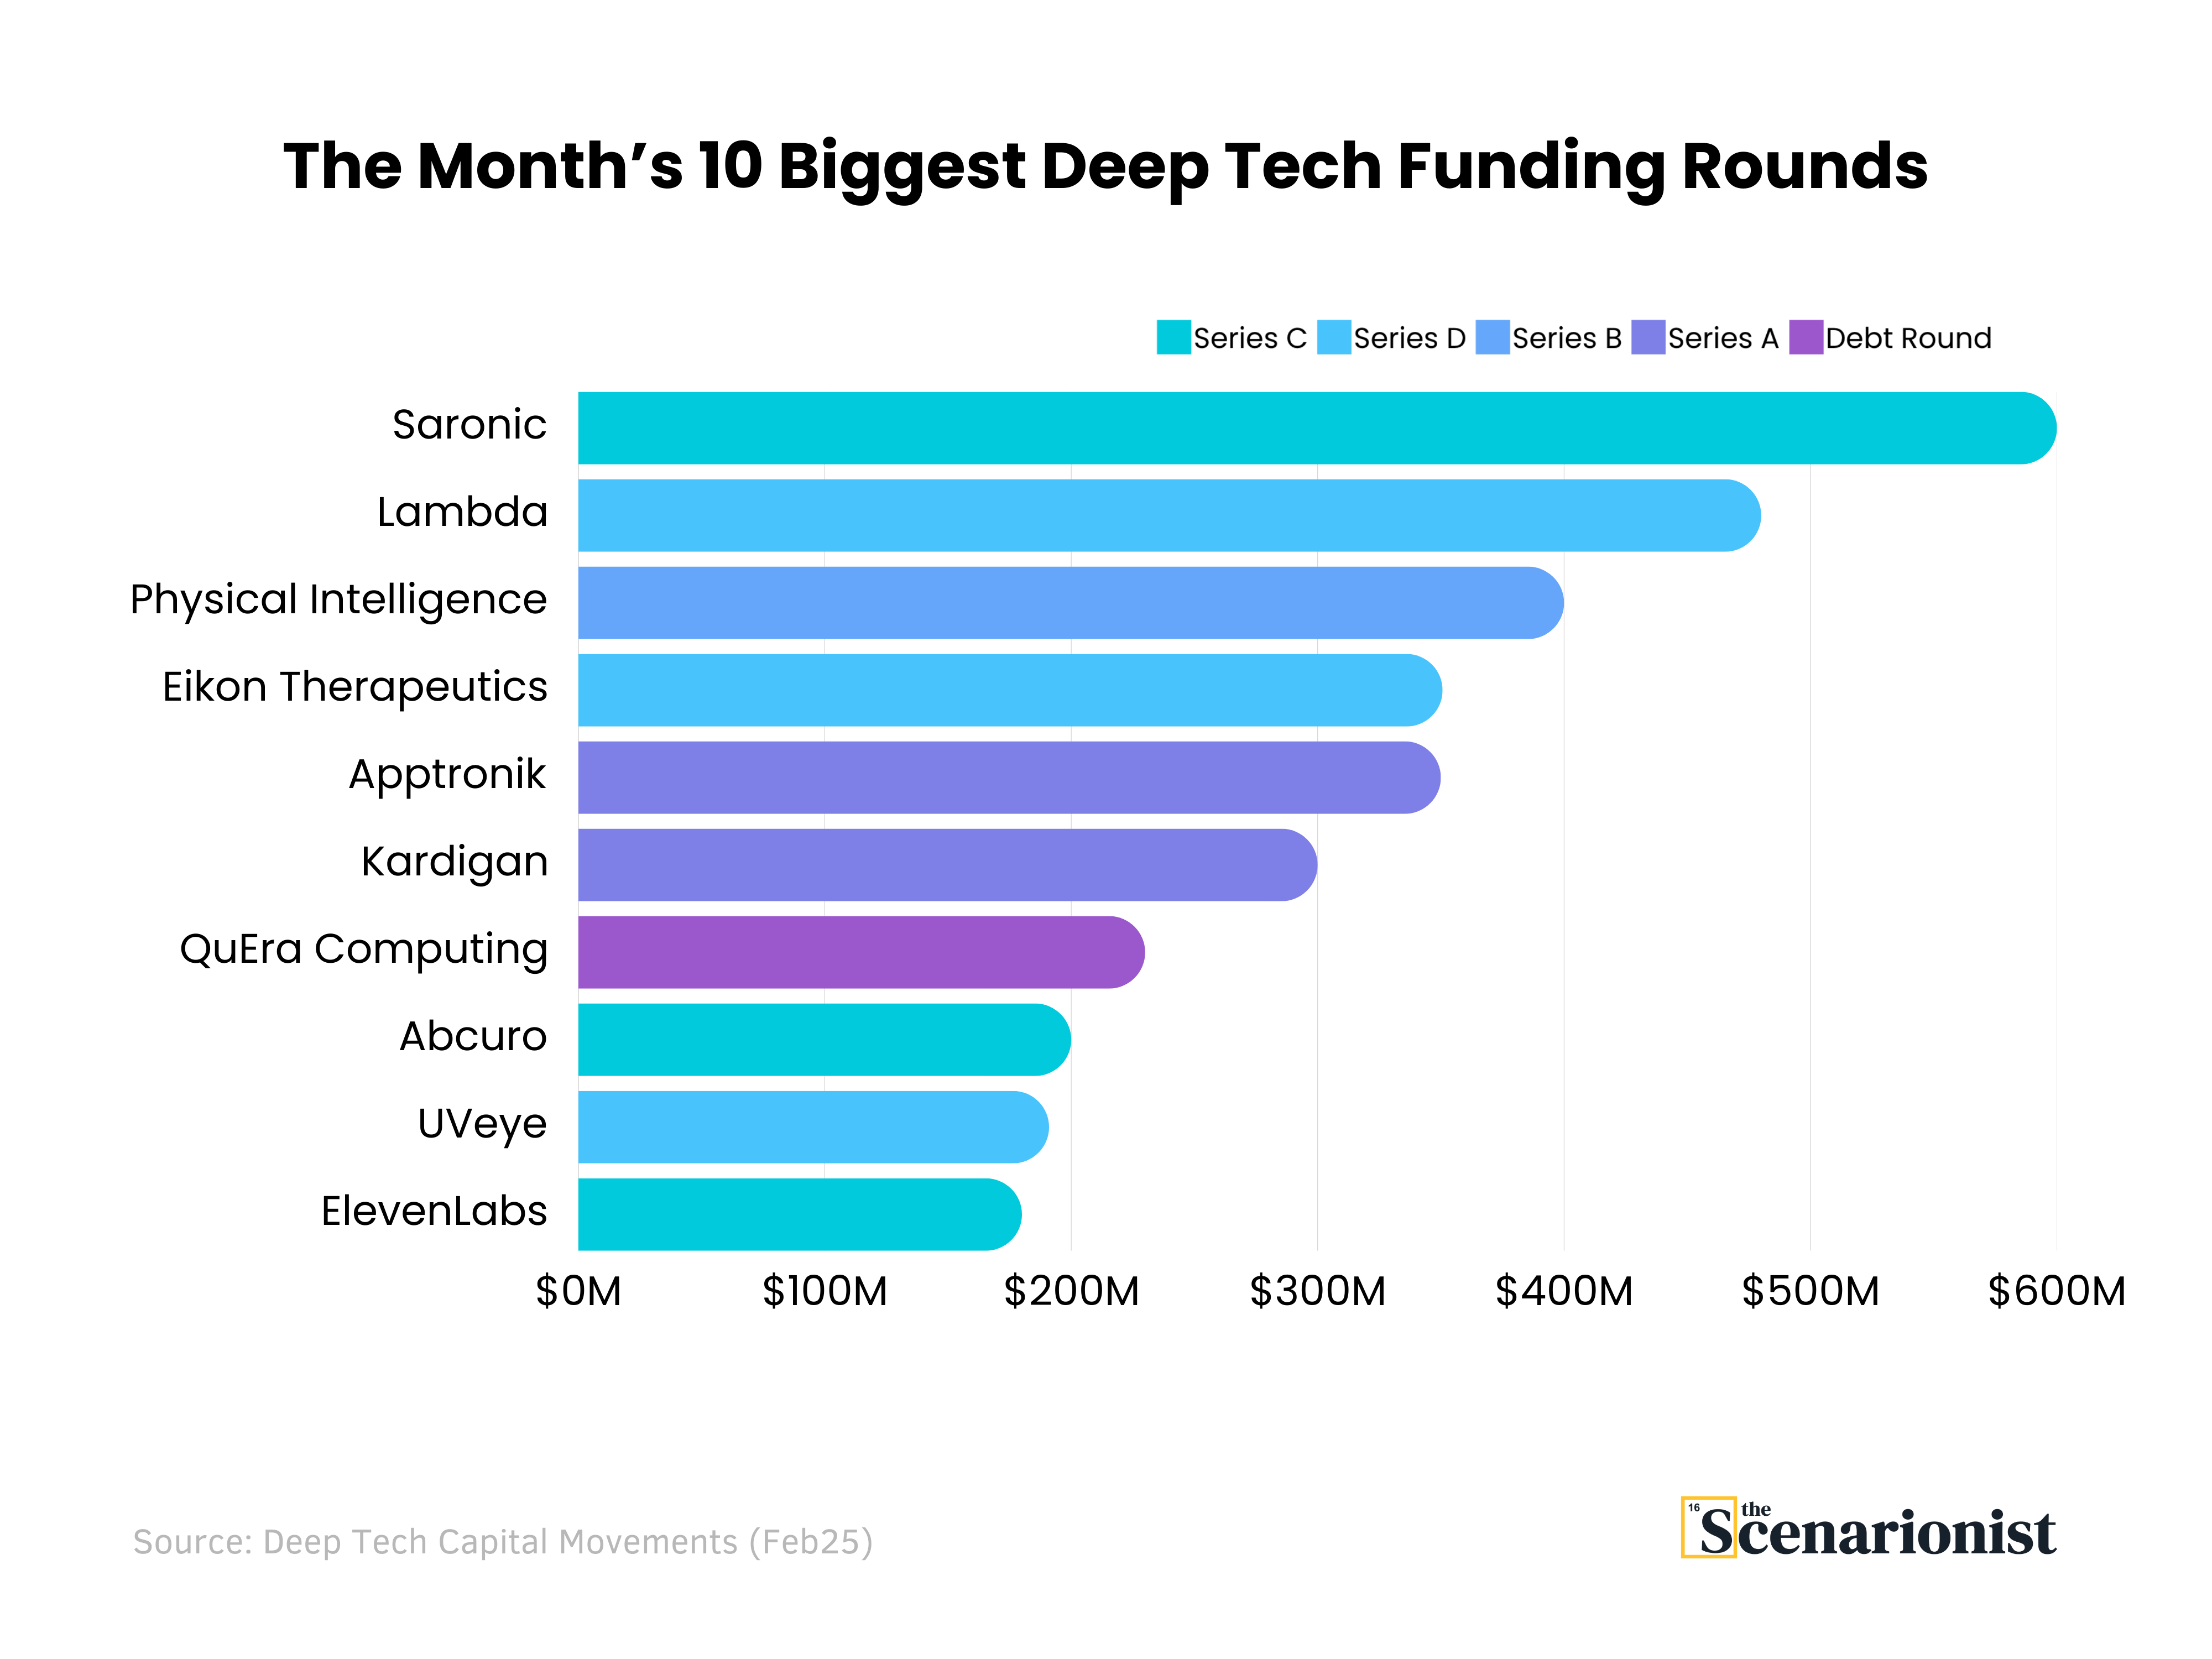
Saronic and Lambda lead the month with significant Series C and D rounds, highlighting continued investor confidence in more mature startups. Meanwhile, Series B and A rounds like those seen in companies such as Apprtonik and QuEra Computing show the breadth of capital flow, with funding across different stages of growth.
Chart 6: From Early Bets to Major Capital Infusions
The Month’s 10 Largest Seed & Series A Rounds

Deep tech startups follow a steep funding curve—many raise Seed rounds under $20M, but only a select few secure the massive Series A investments needed for scaling.
This pattern could indicate that deep tech startups face a high bar for scaling—those that successfully validate their technology can access substantial capital, while others struggle to move beyond early funding stages
Chart 7: Capital Distribution Across Deep Tech Sectors
Total Funding by Sector

This graph showcases the total funding allocated across various deep tech sectors.
Energy, Biotech, and AI emerge as the most prominent sectors, with Energy leading at $1.05B in funding. While AI and Biotech follow closely behind, other sectors such as Quantum and Robotics also show strong investment growth.
Chart 8:
Total Capital Raised by Funding Stage

The progression of funding stages reveals a nonlinear increase in capital allocation.
While Pre-Seed and Seed funding are relatively small, the jump from Series A to Series C+ is exponential. This is likely due to greater investor confidence following early industrial pilots or commercial agreements, which validate the technology’s scalability and market potential. As startups demonstrate real-world adoption, capital deployment accelerates significantly.
Chart 9: Mapping the Global Footprint of Pre-Seed Funding
Geographic Distribution of Pre-Seed Funding

The graph highlights the geographic distribution of pre-seed funding across key deep tech startups.
While investments are spread across North America and Europe, the highest pre-seed rounds are concentrated in Germany and Denmark, signaling strong early-stage support in these regions.
Chart 10: Mapping Deep Tech Investment Across Sectors and Regions
Investment Flow by Sector and Region

The visualization highlights key investment trends in deep tech across different geographies.
The USA and Europe emerge as dominant investment hubs, receiving funding across a broad range of sectors, from AI to semiconductors. Meanwhile, regions such as Israel and Switzerland attract targeted investments, particularly in cybersecurity and biotech.